
Aphanipathes flailum
Horowitz, Opresko, Molodtsova, Beaman, Cowman & Bridge, 2022
GBIF:205135212
ABOUT
Descriptions(9)
Export occurrence data
Darwin Core Archive (ZIP)
CLASSIFICATION
Taxonomic Classification Tree

MULTIMEDIA
Media Files(3)
FIGURE 1. Locations where specimens were collected shown on a bathymetric surface map of the Great Barrier Reef and Coral Sea. Blue boxes represent specimens hand collected while on SCUBA, and red circles represent specimens collected via a remotely operated vehicle.
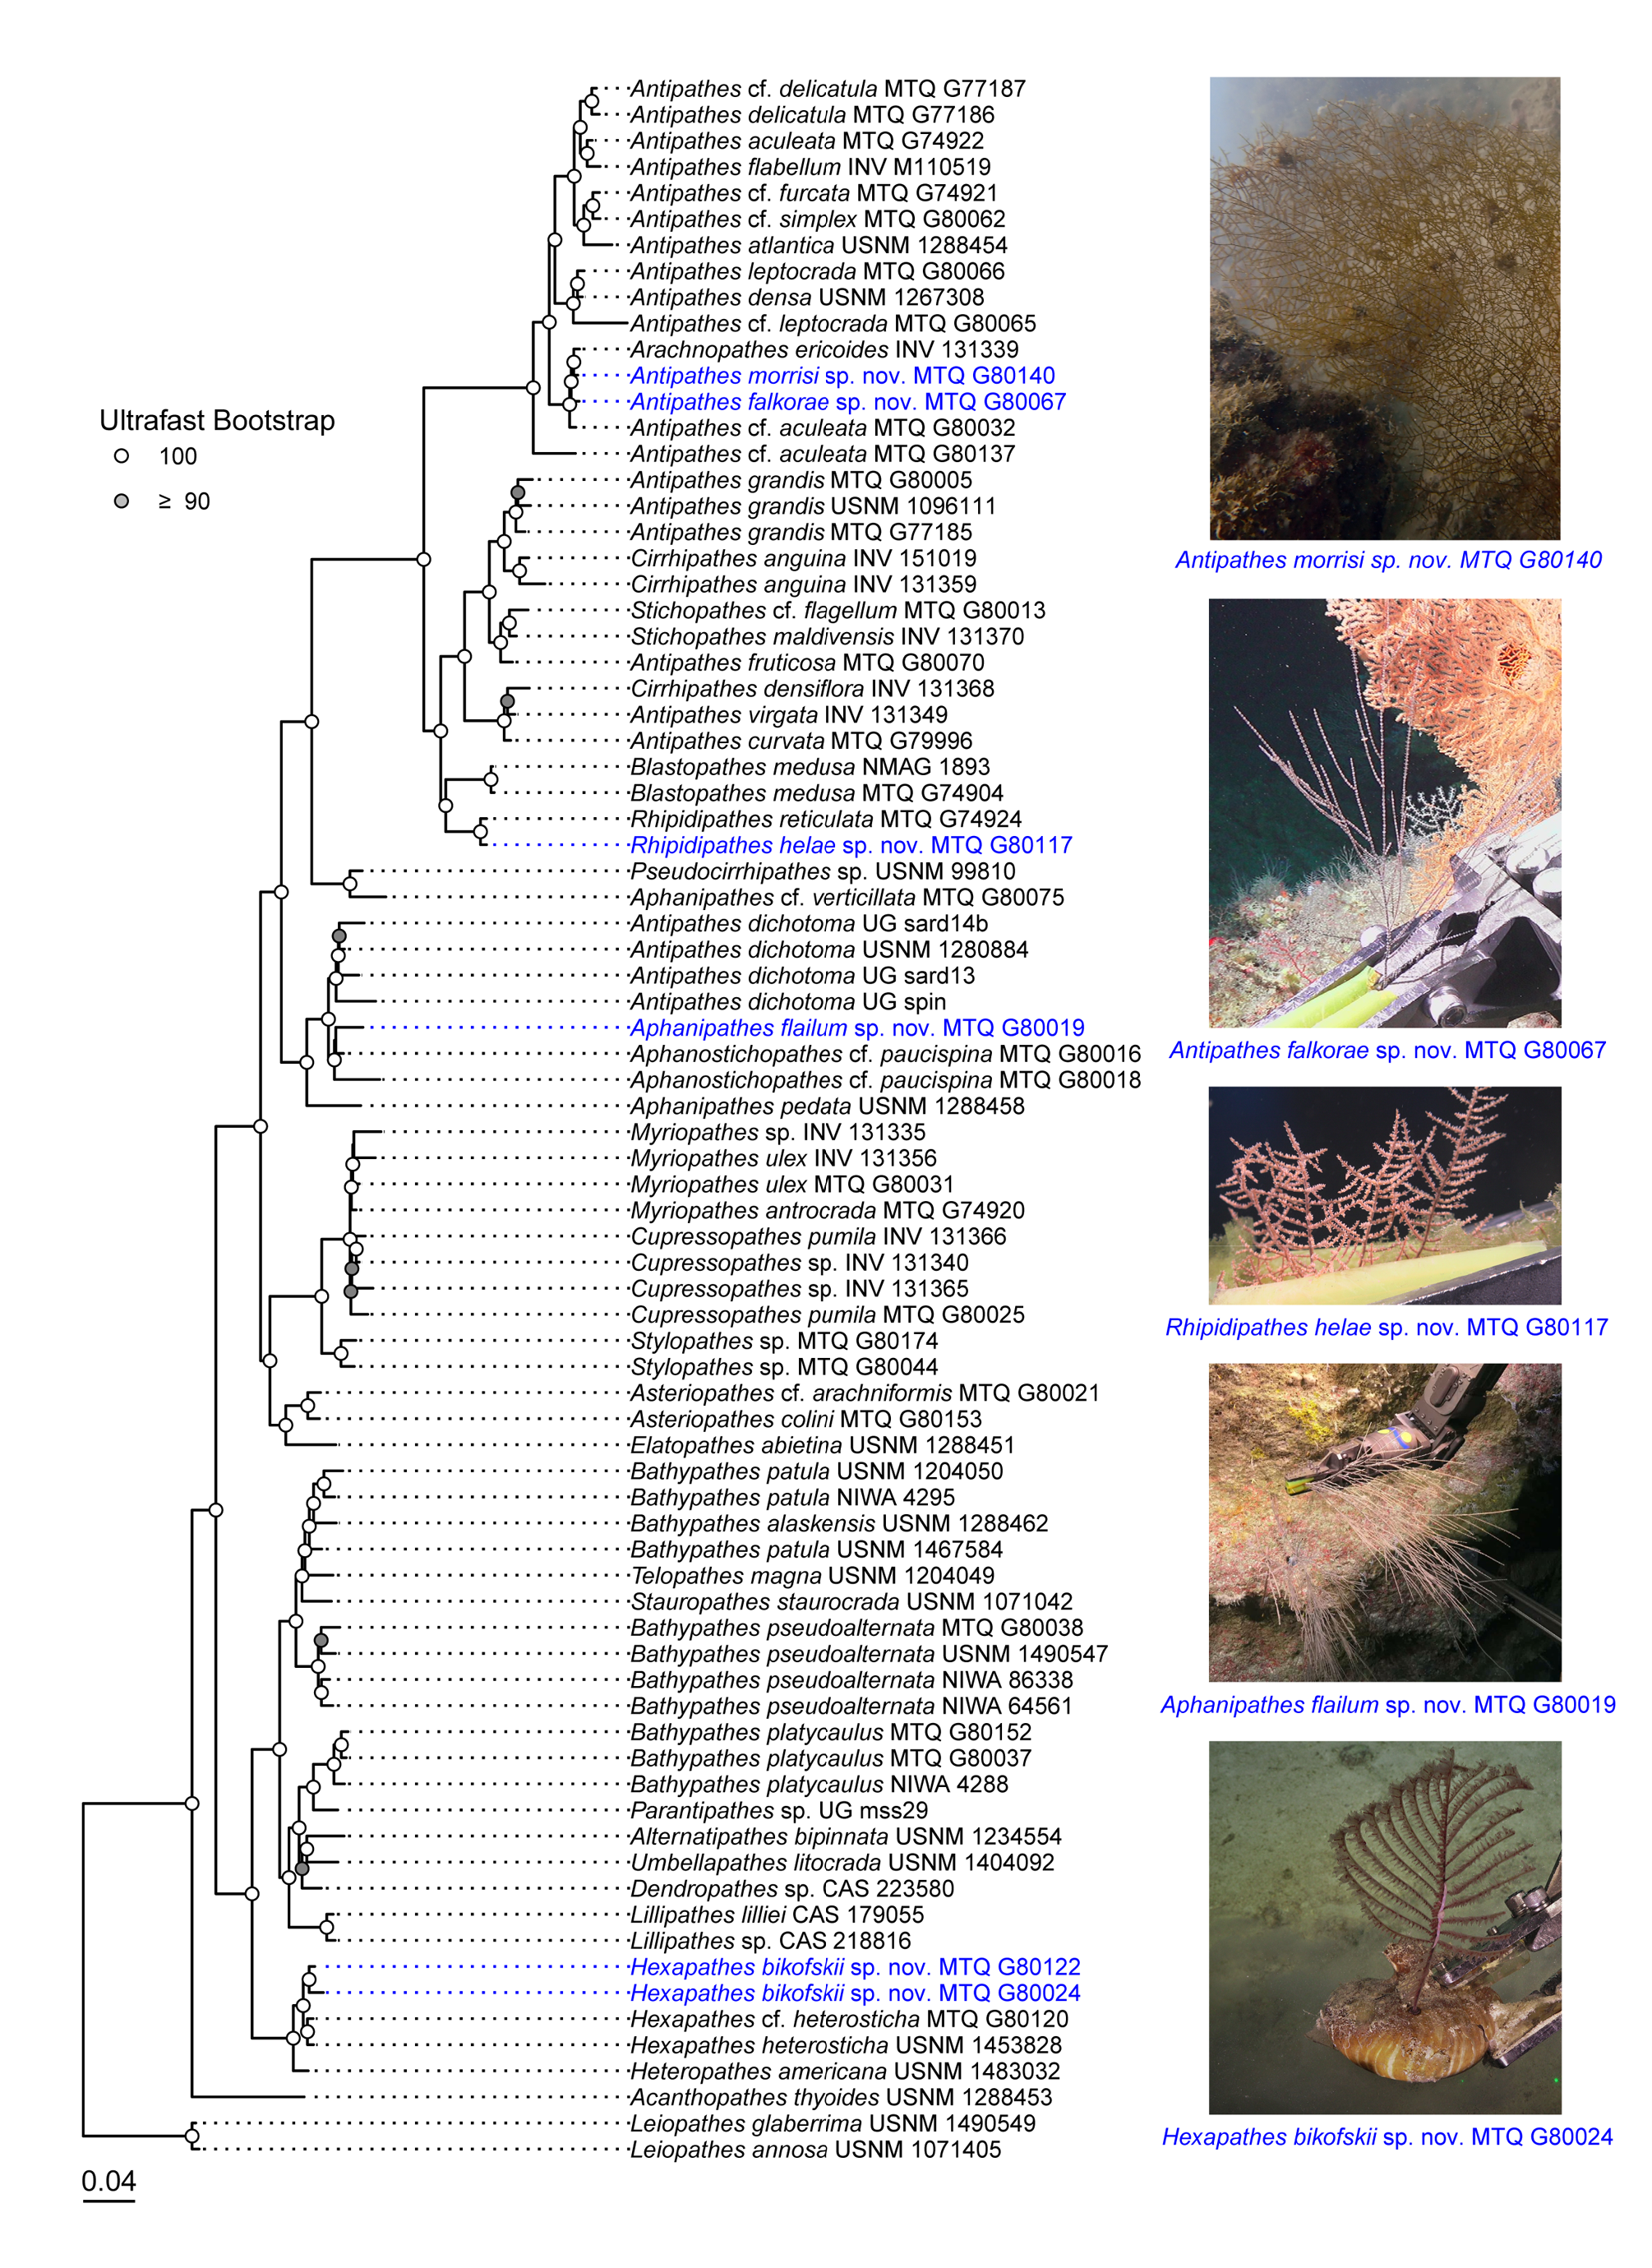
FIGURE 2. Maximum likelihood phylogeny of the Antipatharia based on a 50% complete matrix containing 1,047 loci. Taxa in blue and imaged represent species described in this study.
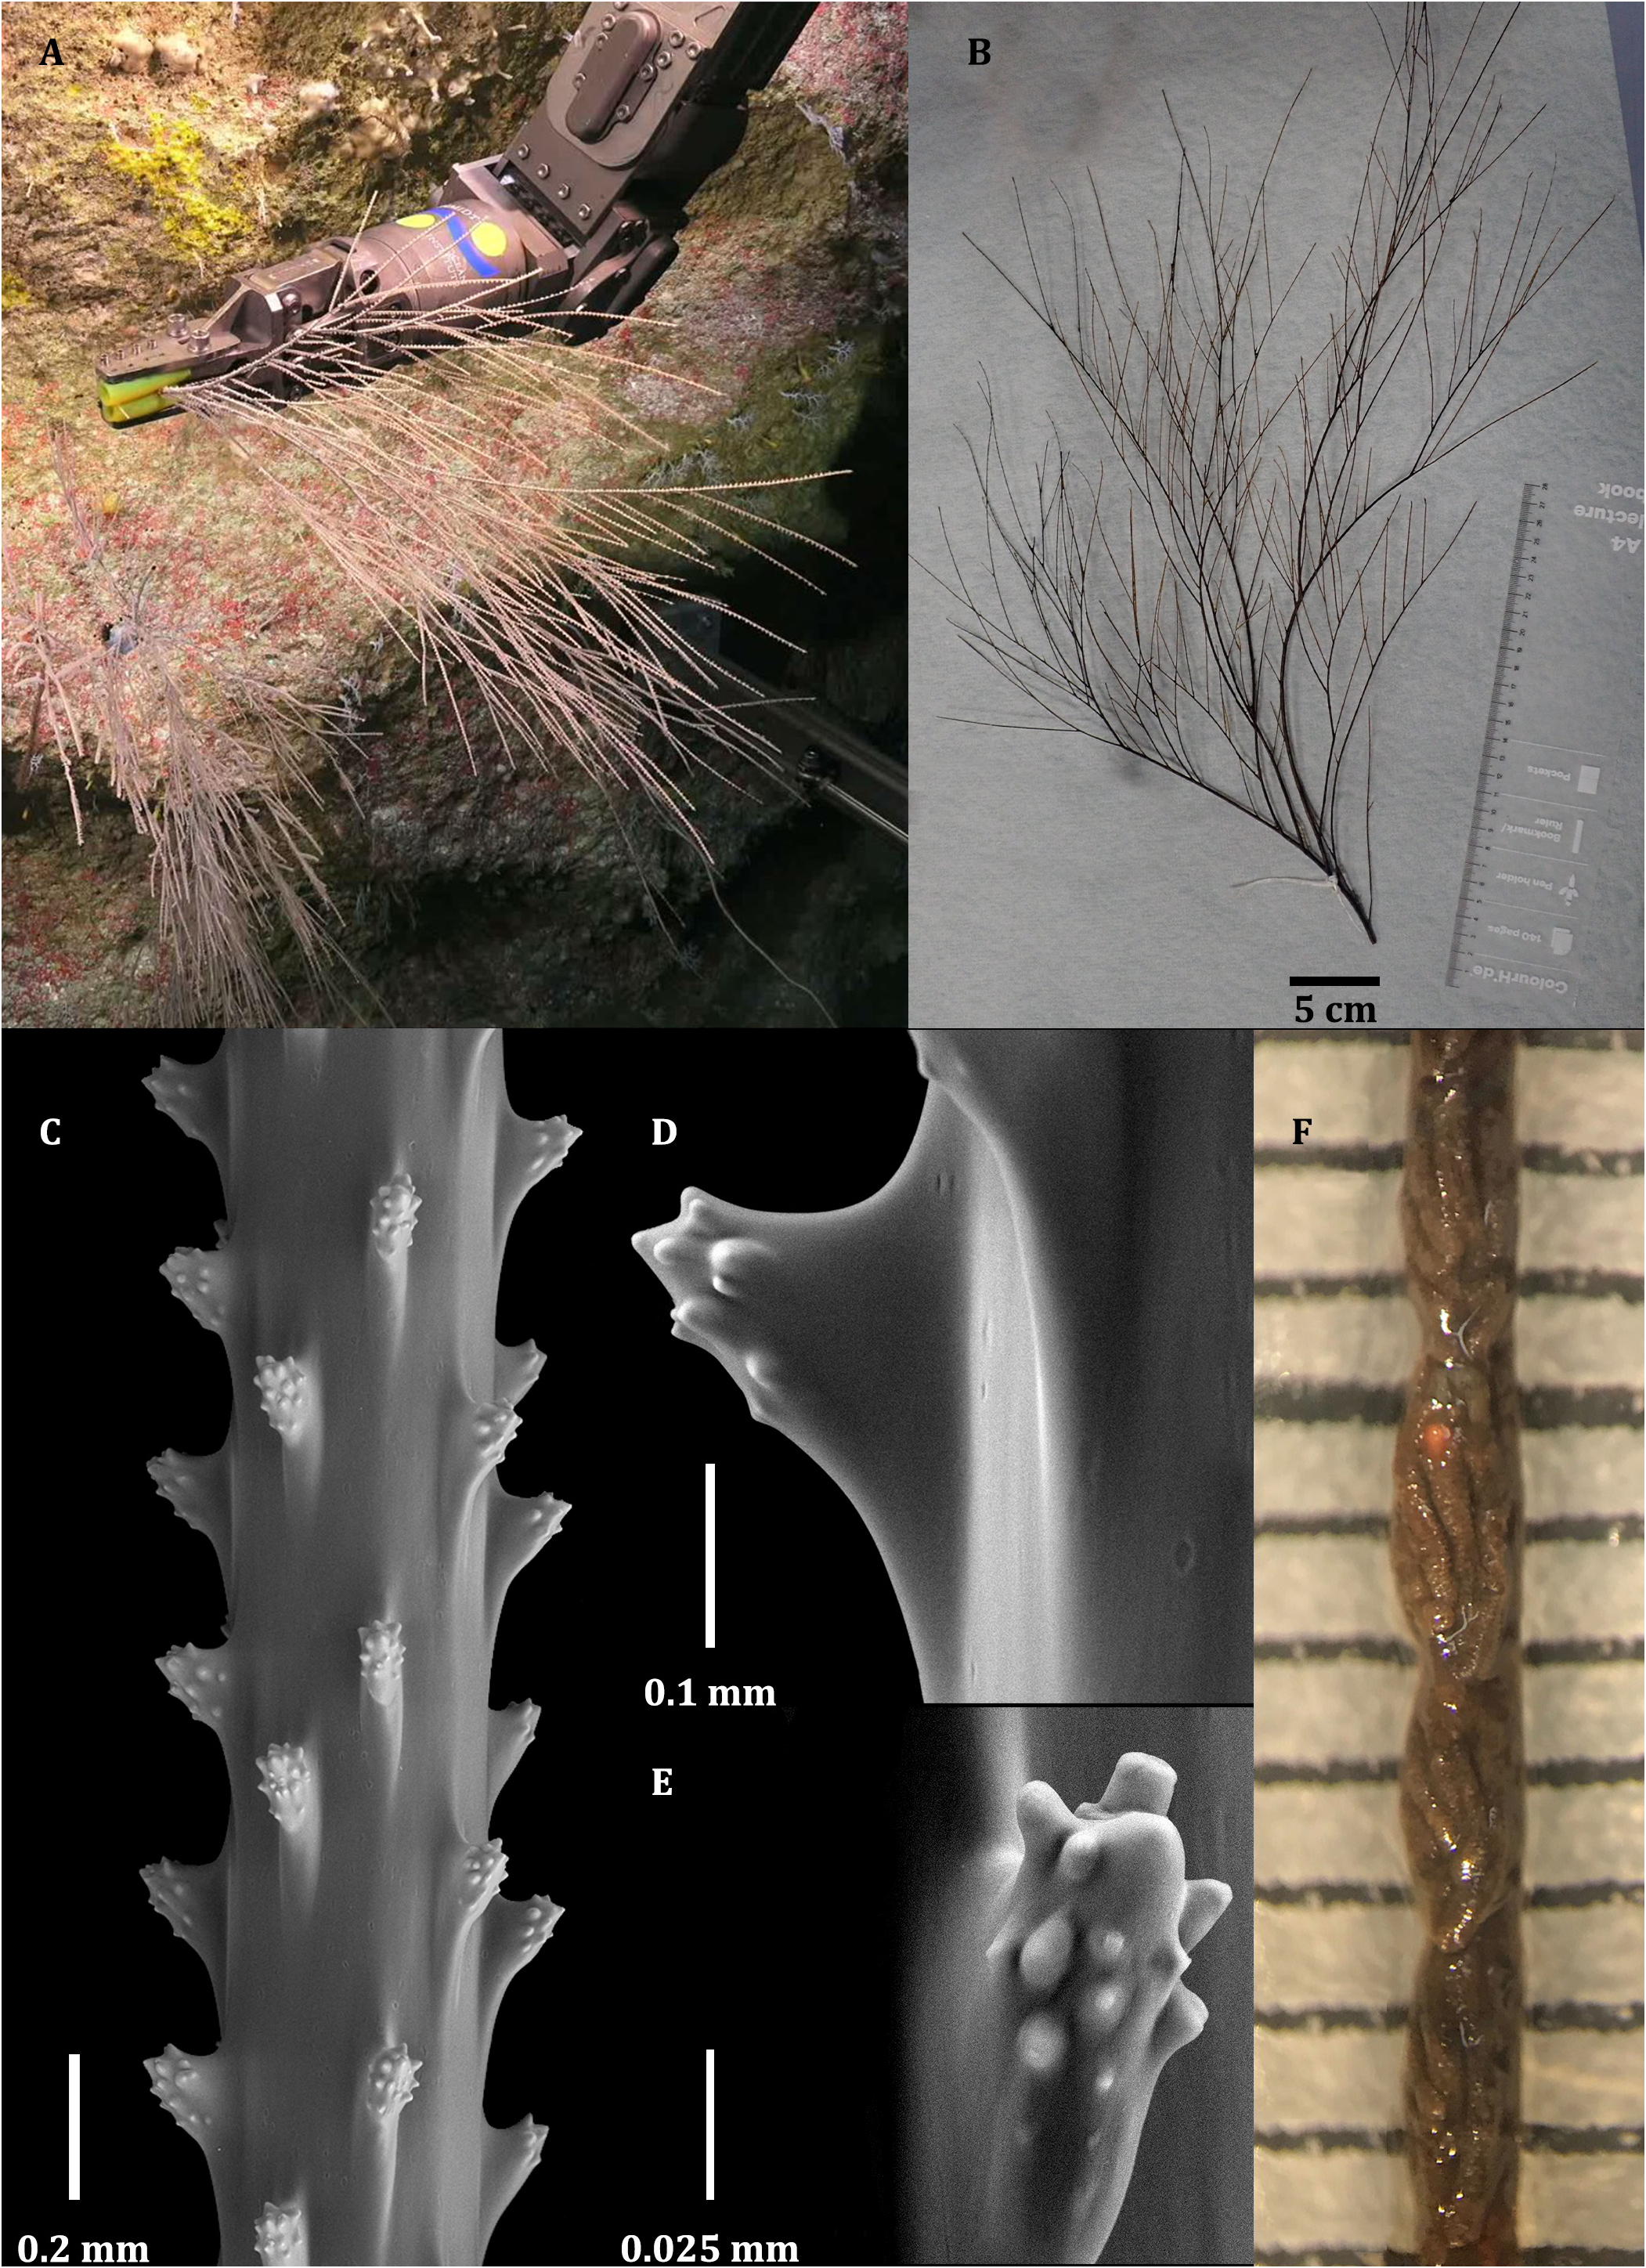
FIGURE 6. Aphanipathes flailum sp. nov. Holotype, MTQ G80019: A, in-situ image of colony; B, image of colony showing branching pattern; C, section of terminal branchlet showing spines with tubercles; D–E, close-up of spines showing tubercle arrangement; F, image of polyps on a branch (distances between horizontal lines represent 1 mm).
IMAGES